
BMLL MARKET LENS: US LIQUIDITY MAPS - April 25, 2024
BMLL Market Lens: US Liquidity Maps provide insight into the US equity markets with a view of the top 500 US stocks across the major trading and execution venues over a rolling 13-month period. The charts are updated monthly and show a consolidated view and a granular breakdown of liquidity across several trade types.
Figure 1 - A consolidated view of US liquidity
A consolidated view of the US trading landscape is essential to truly understand the ebb and flow of overall liquidity in the market. A monthly view of the volume of shares traded over the last 13 months allows market participants to gain this vital insight.
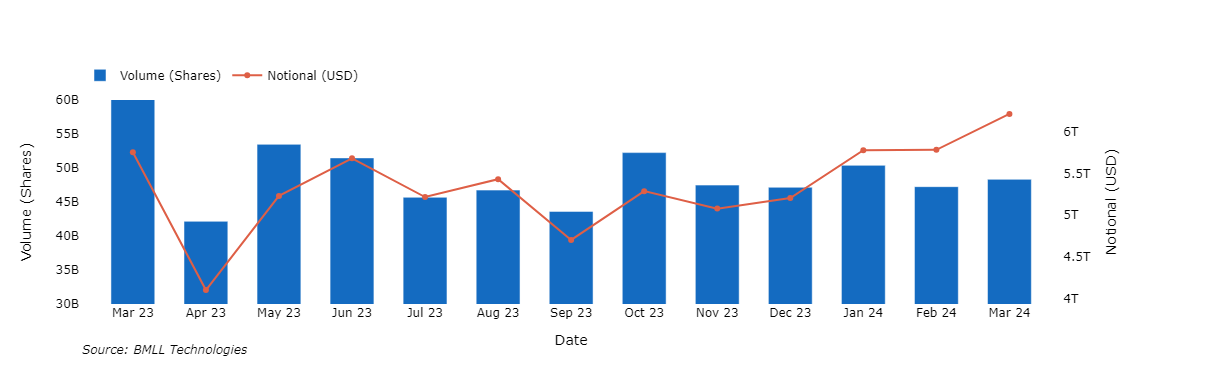
Figure 2.1 - A breakdown of trading volumes
A breakdown of trading volumes across on and off-exchange venues and trading phases provides transparency to any emerging trends relating to the growth of ATS and Non-ATS OTC destinations or a shift from continuous trading to the close.
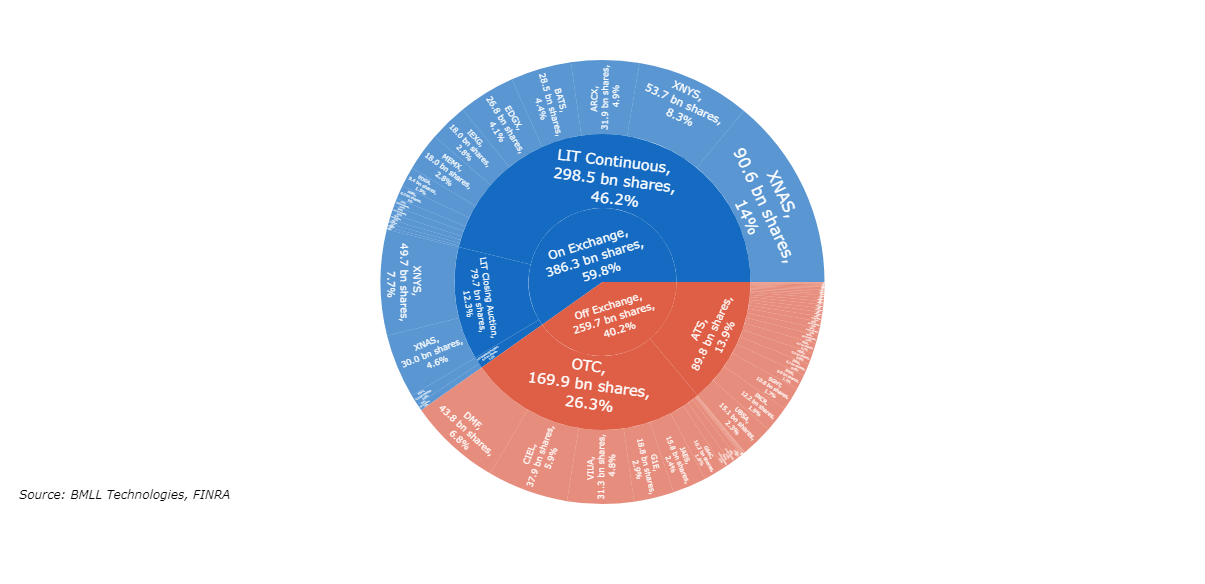
Figure 2.2 - How much is being traded in blocks?
A block trade is defined as one that involves at least 10,000 shares or is worth more than $200,000. Considering both definitions provides a complete picture when trading-in-size and determining an optimal liquidity sourcing strategy. Looking at blocks based on the shares definition alone would misrepresent the level of trading-in-size activity and could result in opportunity cost.
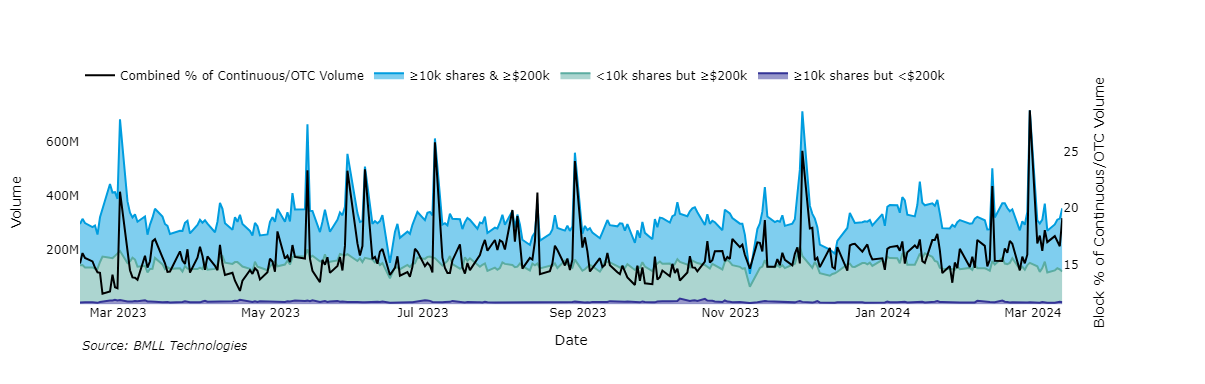
Figure 2.3 - How much is being traded as odd-lots?
Odd-lot trades are defined by being fewer than 100 shares and are often traded at improved prices relative to the SIP NBBO. The SIP NBBO quotes are exclusively based on round lot orders. Therefore, odd lots do not contribute to the formation of the public Best Bid Offer quote. Understanding the distribution of trading volume by tracking odd-lots can support trading strategies that aim to capitalise on spread capture.
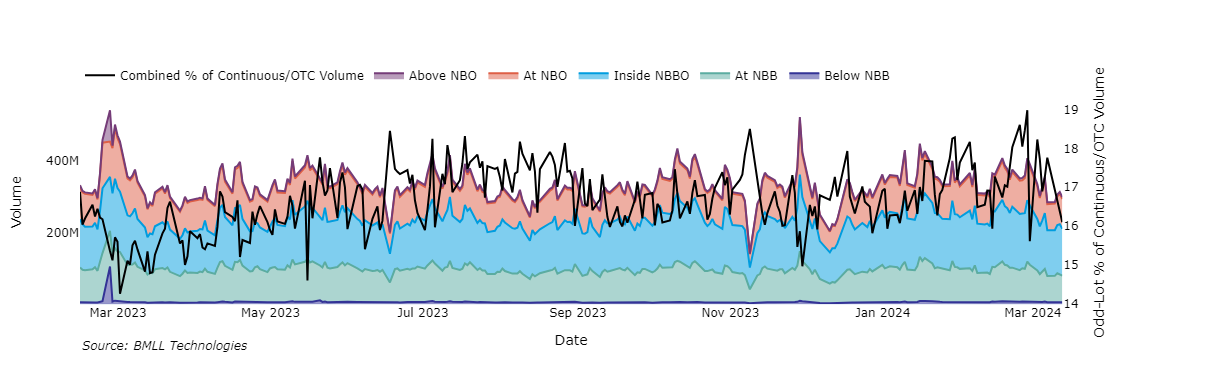
Figure 2.4 - Retail trading trends (share volume and as % of ex-auction trading)
Retail participants differ from their institutional peers in many ways, with trading activity spurred on by unconventional drivers. This market segment represents a unique liquidity pool that market participants across the spectrum may wish to access and interact with. Filtering for odd-lots that have execution prices to 4 decimal places and executed within the SIP NBBO spread (but other than the midpoint) can be used as a proxy for retail trades to monitor volume trends and target this liquidity.
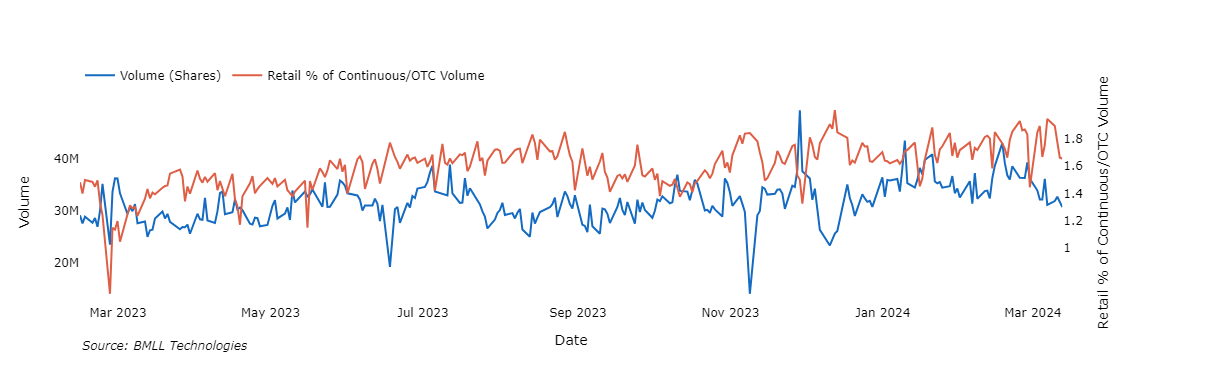
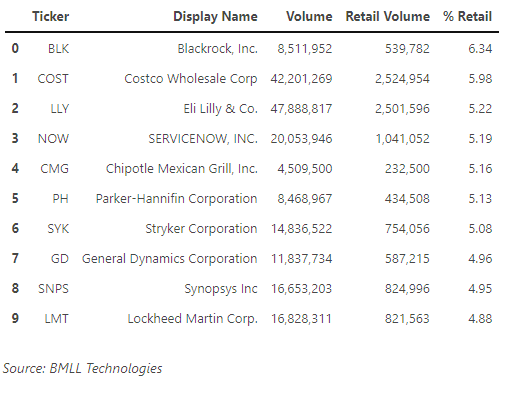
Moreover, the specific stocks that are targets of retail buying or selling remain key focal points for institutions looking to capture this flow.
Using the BMLL Data Lab, we are able to identify which stocks in the past month displayed the proportion of volume which could be identified as likely originating from retail investors.


Member discussion